OEE Defined
OEE (overall equipment effectiveness) is a measure of how well a piece of equipment is performing compared to its full operating potential. It is used to determine the percentage of manufacturing time that is truly productive. Poor OEE performance impacts productivity, competitiveness, and profitability.
Schedule a Demo
The OEE Calculation
As shown below, the formula for calculating OEE is very straightforward.
OEE = Availability x Performance x Quality
An example:
-
Availability:
A machine was scheduled to run for 8 hours but only ran for 7. 7/8 = 87.5%.
-
Performance:
A machine has an optimum output of 5,000 units during an 8-hour shift but only produces 4,200. 4200/5000 = 84.0%
-
Quality:
The machine produced 4,400 units during the 8-hour shift but only 4,100 of them passed quality inspection. 4200/4400 = 93.2%.
In the above example the calculated OEE would be 0.875 x 0.84 x 0.932 = 0.685 (68.5%).
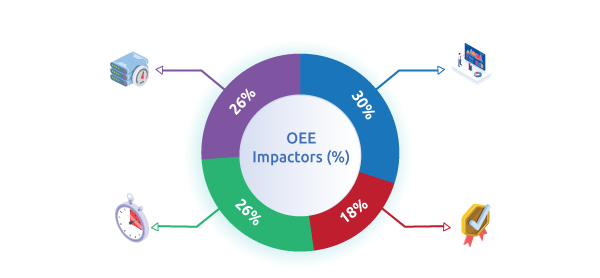
- PoorFrequent, unplanned down-times. Low and inconsistent output. High scrappage rate. Long delivery lead-times. Short asset lifespans. High operational costs.
- Sub-ParMinimal OEE control. Product output still less than normal capacity. Inconsistent quality of products produced. Costs still too high to be competitive.
- AverageOperationally average. Machines and processes operate at average rates. Typically, sill reliant on manual maintenance processes. Have reached a state where embedded intelligence is needed to further maximize performance.
- Above AverageSome advanced OEE control mechanisms in place. Assets and processes are performing above the norm. Some predictive analytics are in place. Assets are better managed, producing longer lifespans.
- ExceptionalEmbedded and Edge intelligence are being used to provide best-in-class OEE scores. Transition to predictive maintenance has been completed. True operational excellence has been achieved, producing segment-leading costs and pricing.
Many machines and devices do not have the ability to self-monitor or self-report. Critical performance insights go undetected and/or unreported. Closing these performance gaps requires solutions that provide local synthesis, analysis, and communication of machine data—in real time.
The New OEE Benchmark – 80% – 85%
Many manufacturers have been operating at OEE levels of 60 – 70% over the past couple of decades. That has enabled a transition from a purely reactive manufacturing environment to one that is more planned. Breaking the 70% OEE barrier requires AI-enabled OEE analytics that provide OEE insights that are faster and more predictive.
Increasing OEE scores can have the same effect as adding a new production line!
Explore relating Products & Solutions