Health Scores - Networks - www.micro.ai Health Scores - Machines | Learning Center | MicroAI
33009
page-template,page-template-full_width,page-template-full_width-php,page,page-id-33009,page-child,parent-pageid-32954,bridge-core-1.0.4,mega-menu-top-navigation,ajax_fade,page_not_loaded,,qode-title-hidden,qode_grid_1400,qode-content-sidebar-responsive,wpb-js-composer js-comp-ver-5.7,vc_responsive

Health Scores – Networks

At-a-glance visualization into the health and performance of telecom networks

Schedule a Demo

Network Health Scores

As fixed and mobile networks continue to expand in size and complexity, the delivery of a great customer experience will become increasingly dependent upon the ability to maintain constant visibility into network performance. AI-enabled network health scores provide the real-time observability necessary to maintain peak network performance.
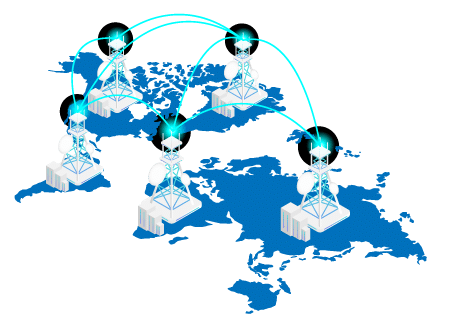
NQoS

Network Health Metrics

Network heath scores provide qualitative analytics into a wide range of network performance metrics.


  • Latency

    A measurement, in milliseconds, of the amount of delay in transferring data across the network.


  • Jitter

    A measurement in the amount of variance in data latency.

  • Machine and device

    Speed

    The rate at which data is transmitted between devices on the network.


  • Bandwidth

    The maximum amount of data (bytes per second (bps)) that a network connection can transmit within a specific amount of time.

  • Uptime

    A measurement of the amount of time (in %) that a network is fully operational. A key component within NQoS (network quality of service).


  • Packet loss

    The percentage of data packets that are dropped/lost during transmission and fail to reach their target destinations.

  • Network utilization

    Real-time measurement of the percentage of total network capacity that is being consumed and the amount of existing headroom.

Network Health Score Impacts

AI-powered health scores provide the analytics and visualization necessary to establish, and maintain, deep observability and real-time control of network performance.
  • Real-time Network Monitoring

    Operators and service providers can troubleshoot issues down to a specific root cause (device, tower, network hardware, etc.) and take quick, accurate, action to eliminate the problem.
  • Live Impact Assessment

    Operators can quickly determine the effects of negative performance on user experience. User experience data generates deeper insights into customer satisfaction, behavior, and loyalty.
  • Live Visualization

    An onboard visualization engine provides live observability into the performance and health of the network. Health scores provide at-a-glance status and alerts.
  • Faster identification and mitigation of performance issues Ability to quickly determine issue impact on user experience Predictive analytics that support forward-looking network performance Deeper insights into user perceptions and behaviors Improved customer experience, brand loyalty, and NPS scores